Platform · Analytics
Every number an FFL owner asks about. On one screen.
Sales today, sales last quarter, the inventory that's been sitting too long, the items quietly carrying your margin, the distributor that actually pays off, the storefront sections customers click, the search terms they typed, the traffic from Google. All in /insights, with a range picker and a compare-to-prior-period toggle on top.
No credit card required · 14-day free trial · Cancel anytime
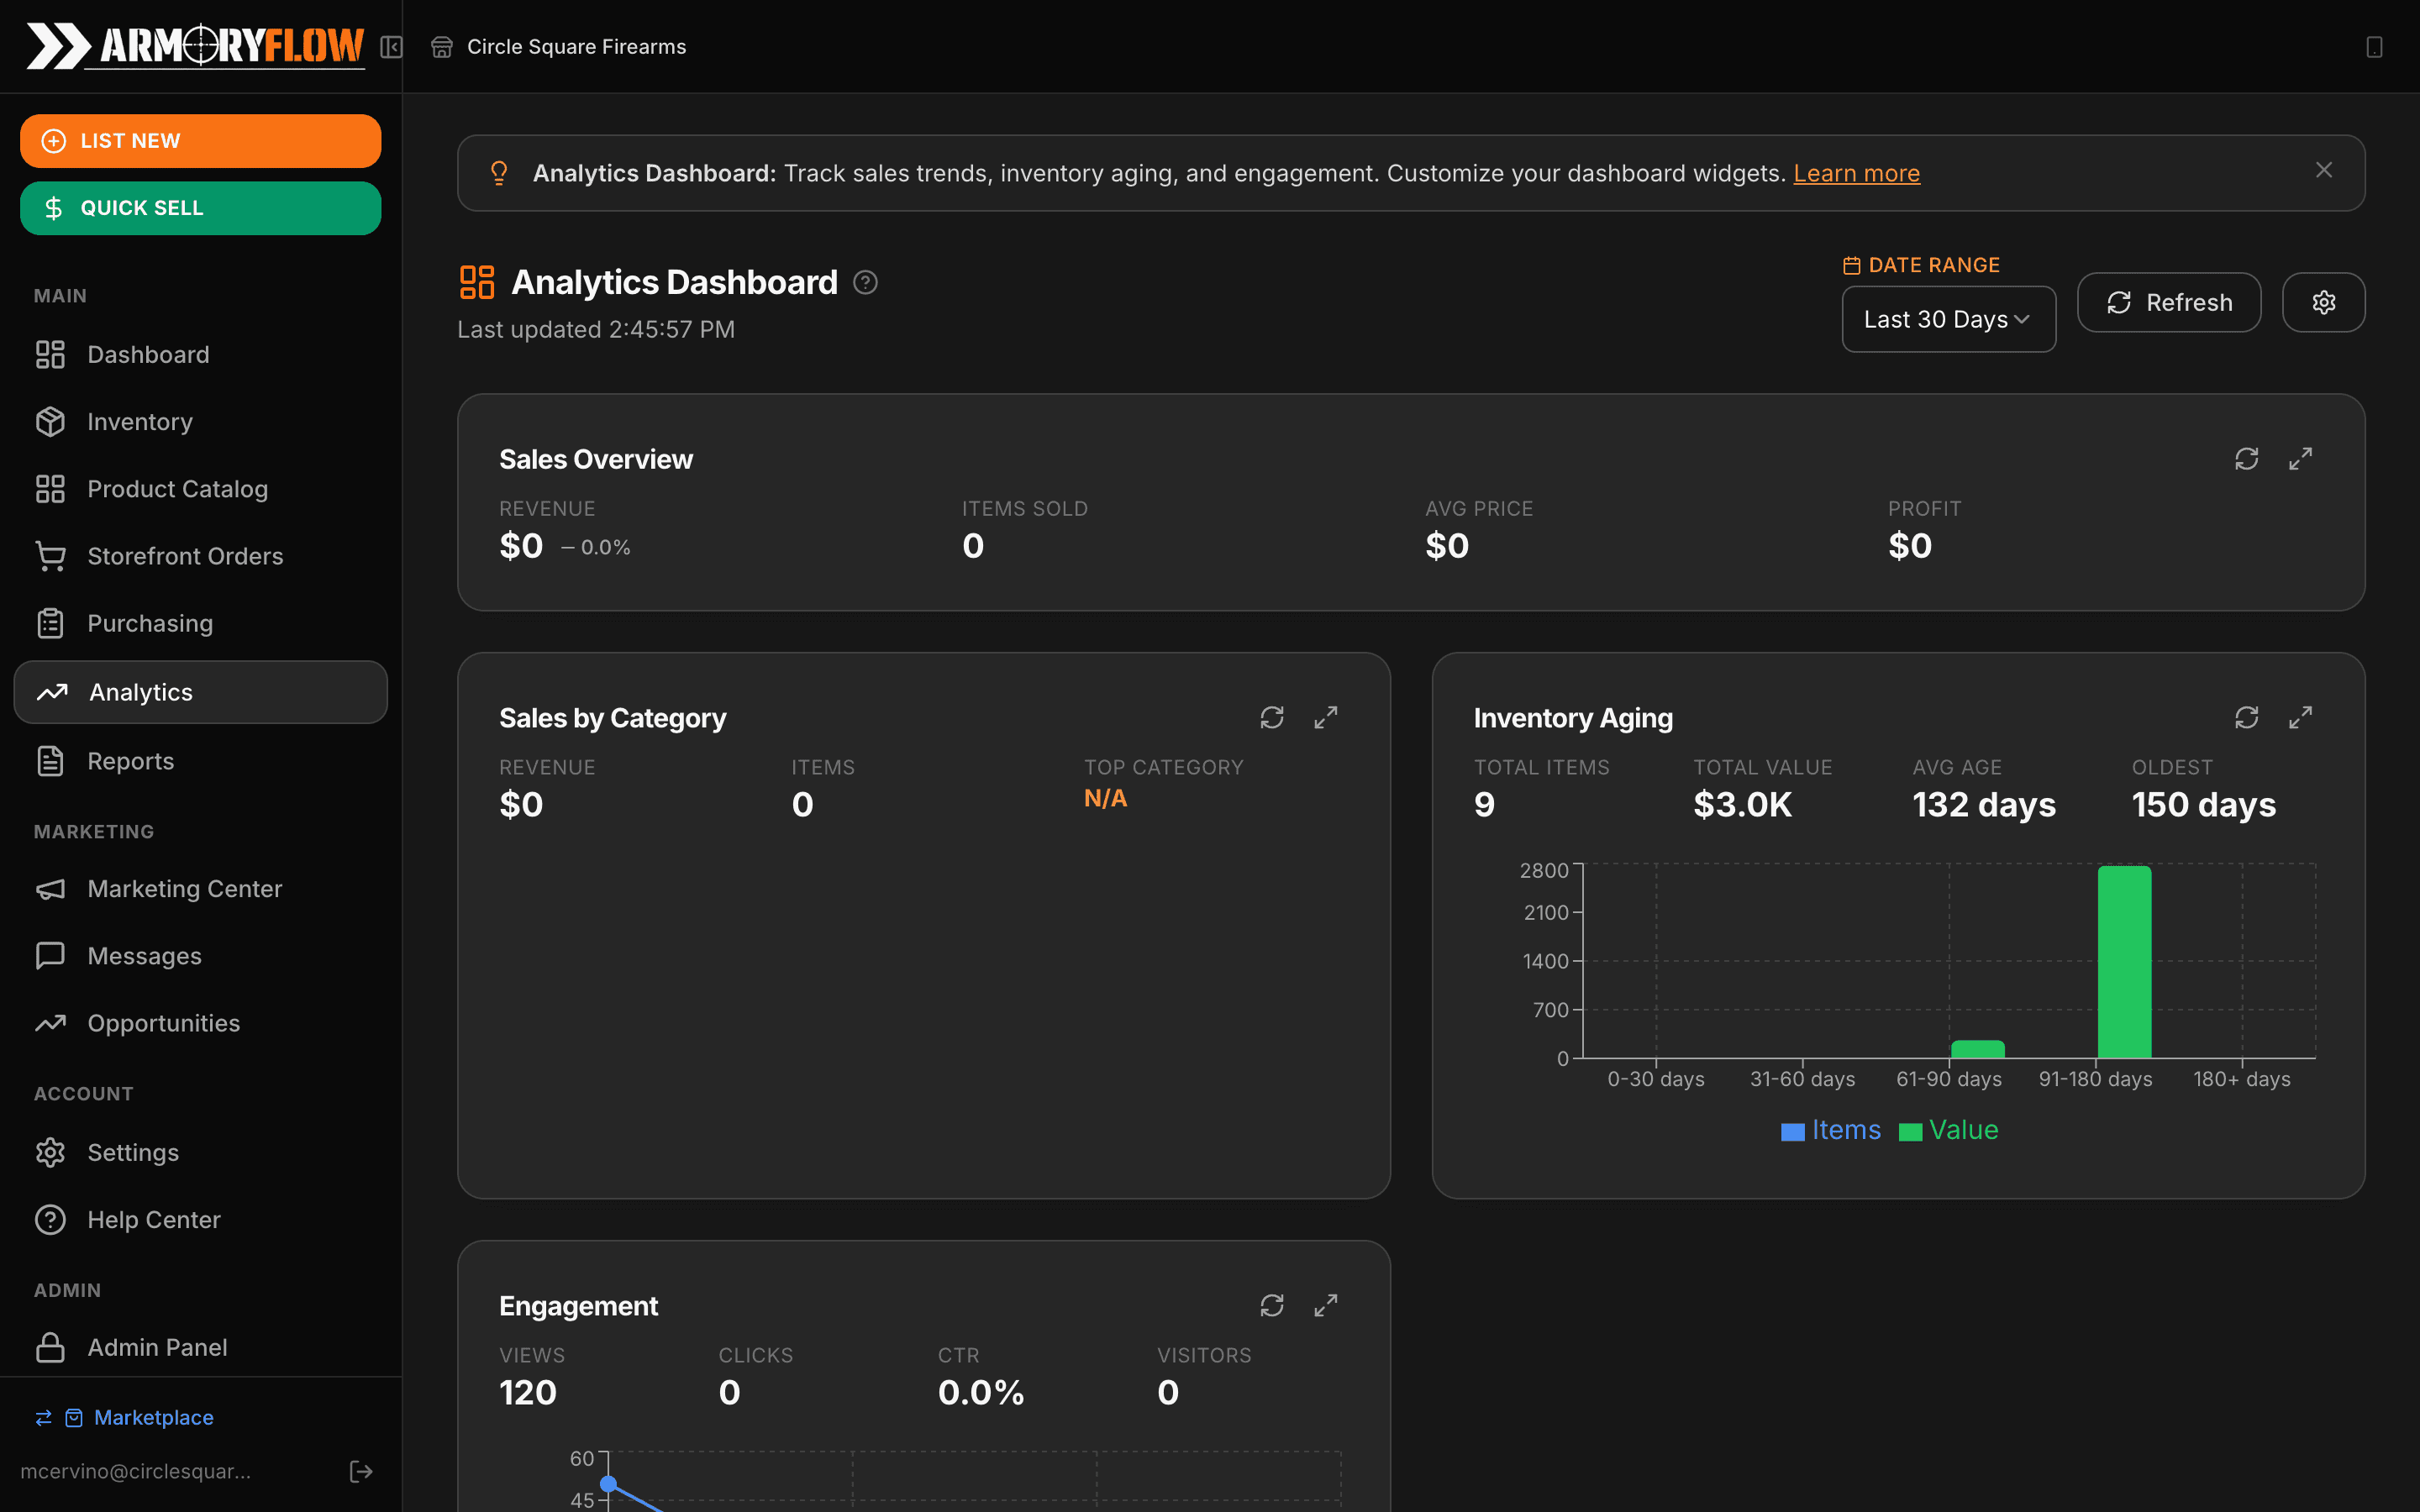
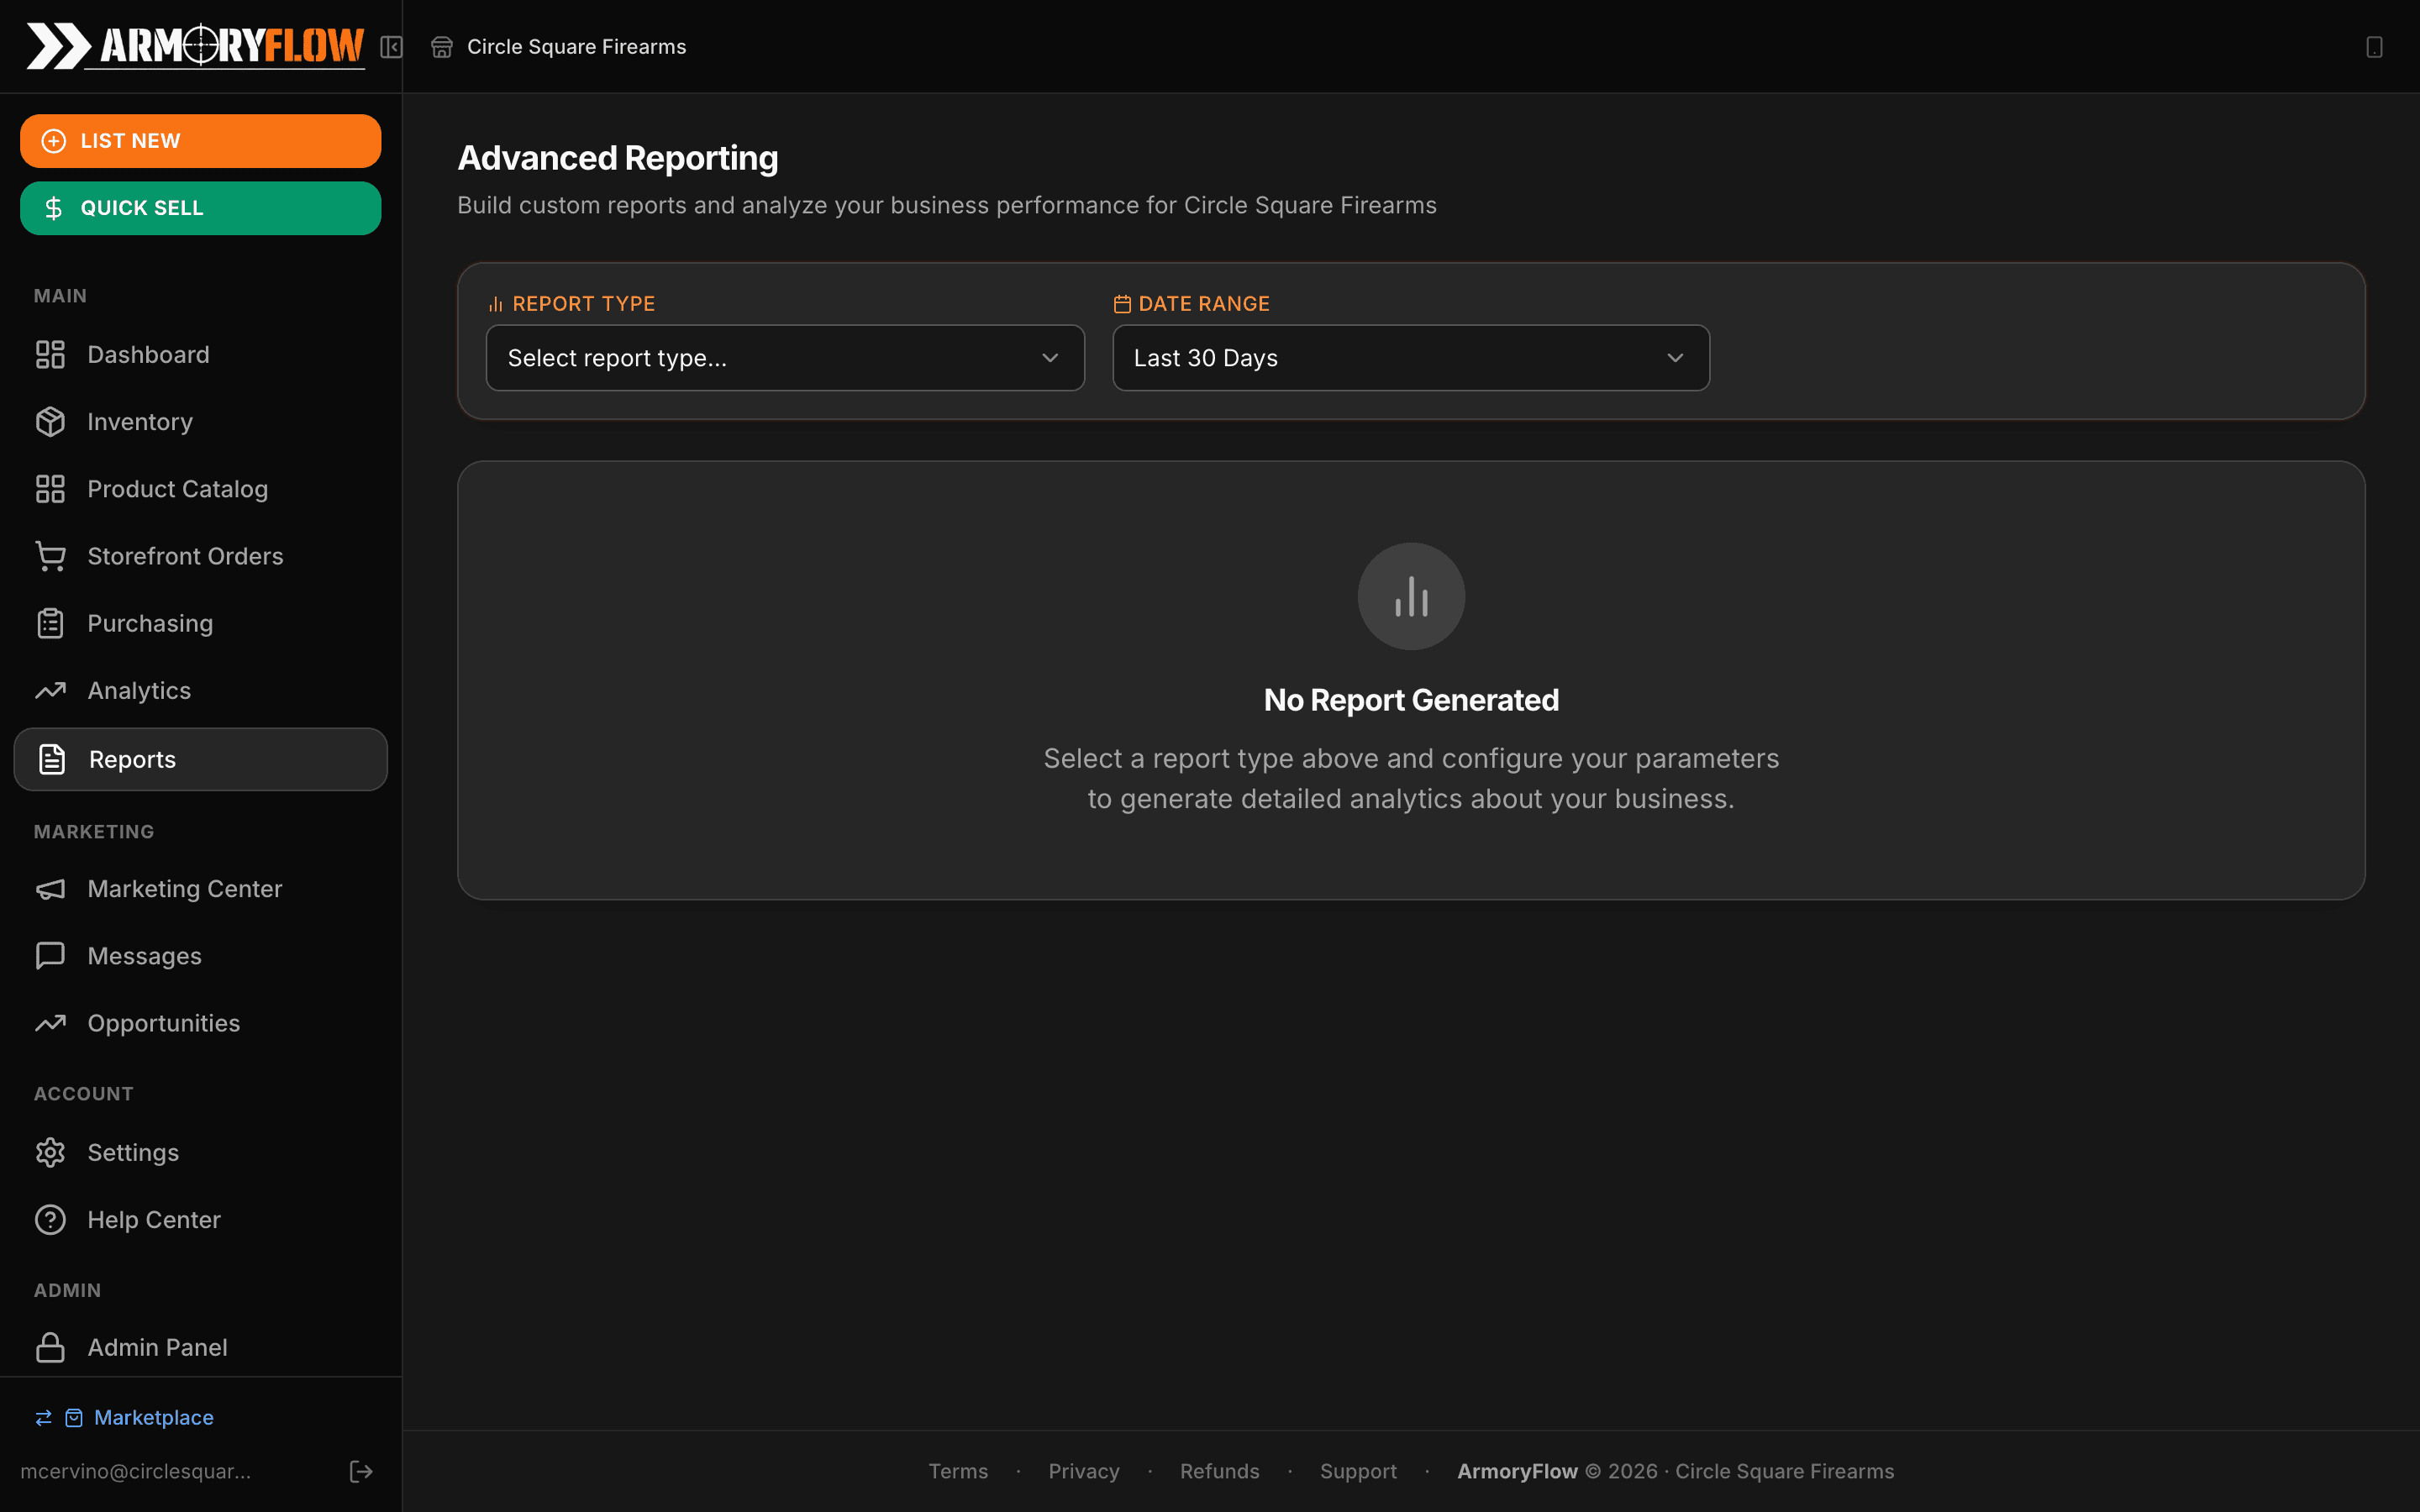
Sales: what you actually sold
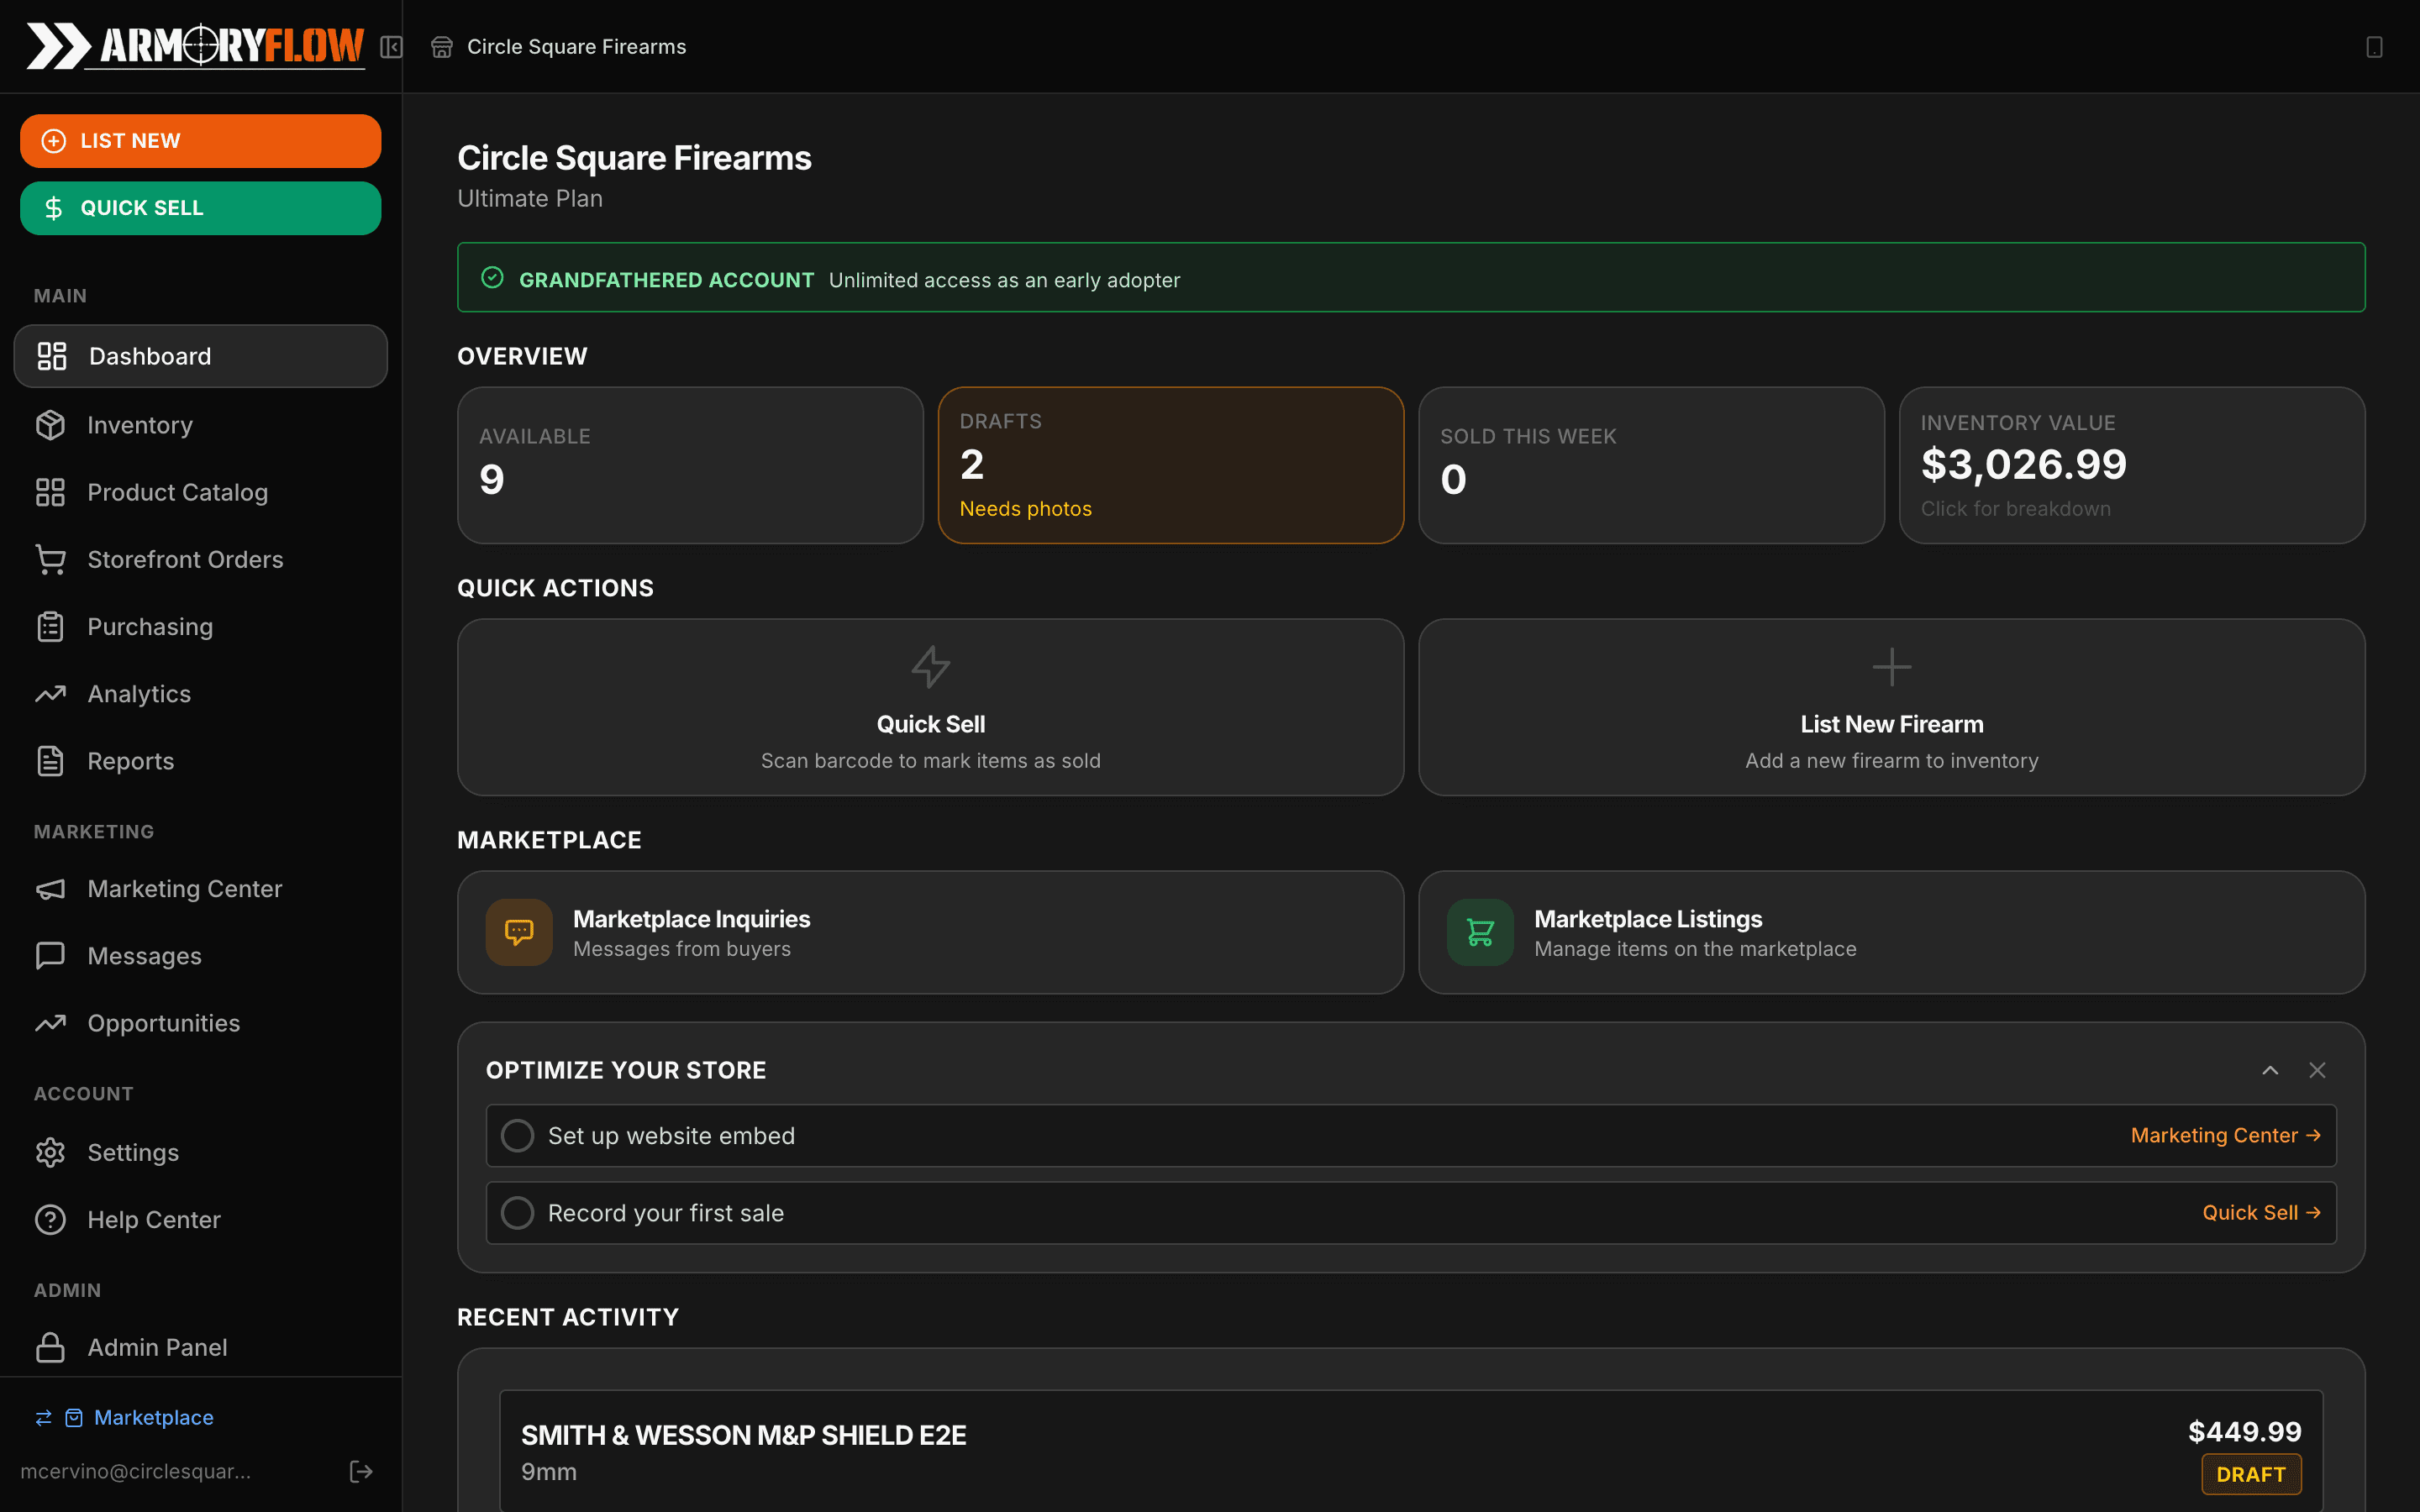
Revenue today, week-to-date, month-to-date, 7 / 30 / 90 days, year-to-date, with a one-click compare-to-prior-period toggle. Orders, AOV, top sellers, slow movers. If 9mm carbines have been quietly carrying you for three months, you'll see it on the dashboard before your distributor rep tells you. Drill into any number to the specific orders behind it.
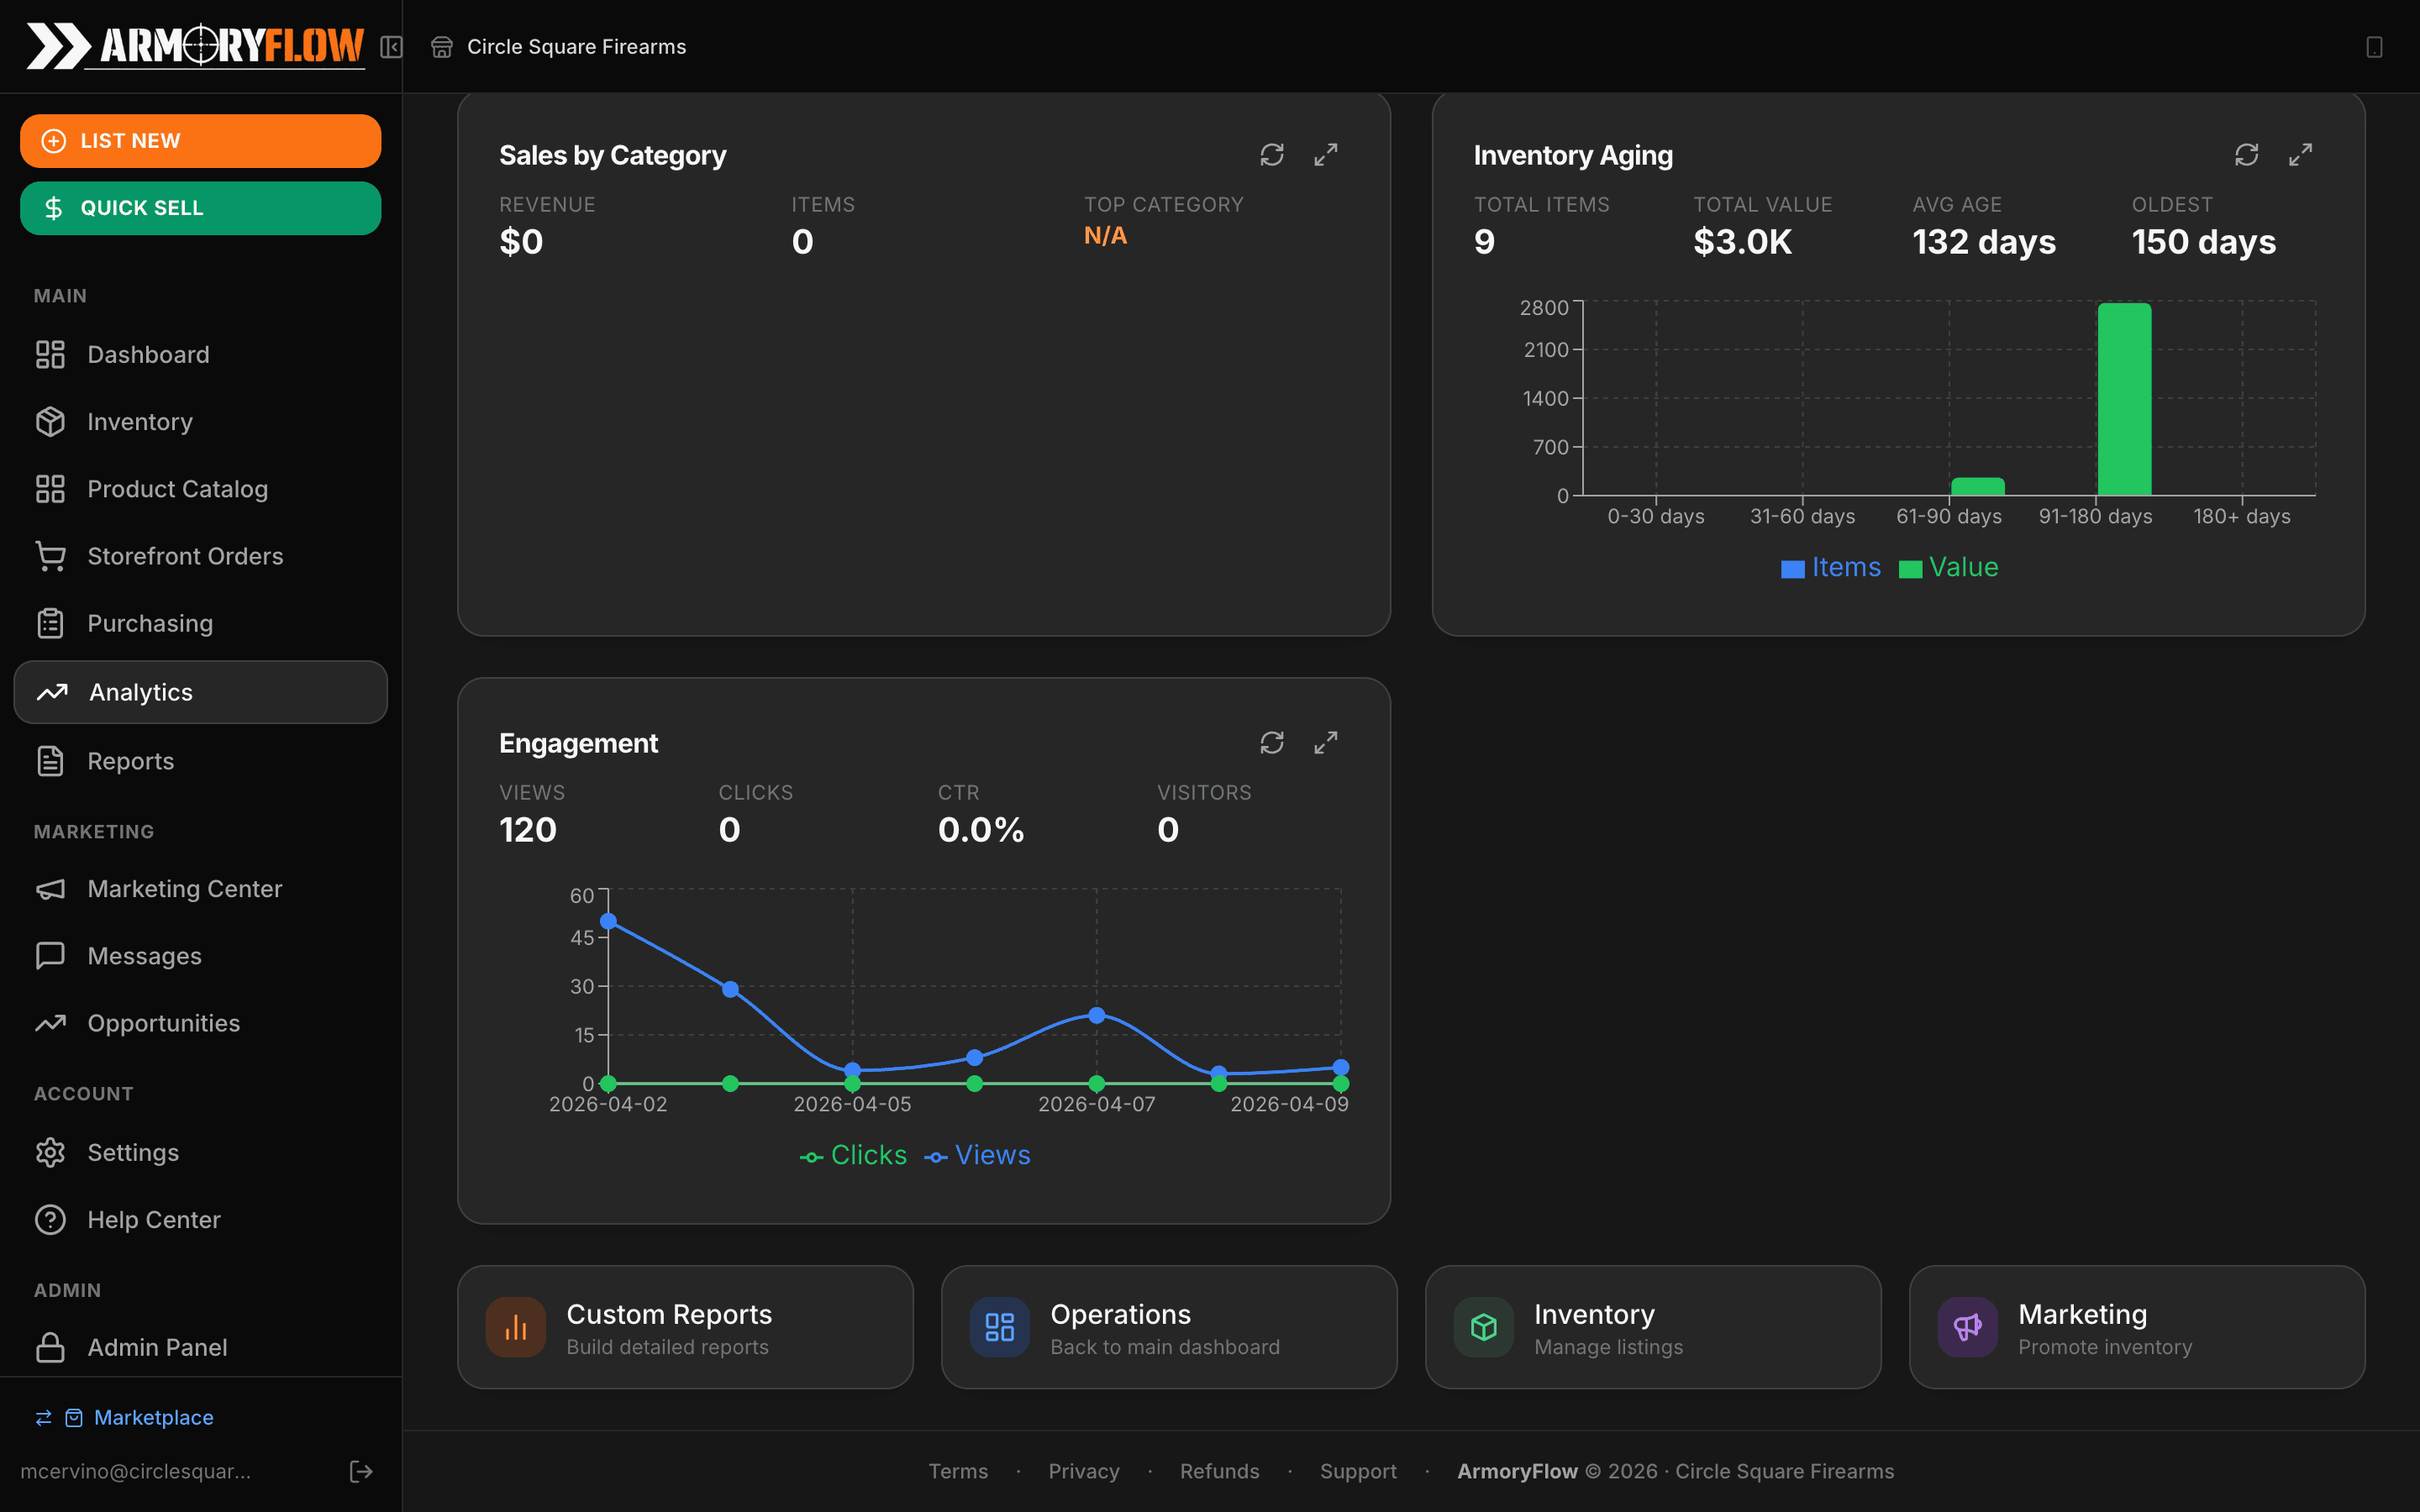
Inventory: what's sitting too long
Every item has a days-on-shelf counter. Aging bars show you 30-day, 60-day, 90-day, and 180-plus buckets at a glance. A dedicated dead-stock list calls out the guns tying up capital before you hit the "been here too long" mark. Most shops mark something down a month later than they should. The aging report is how you stop doing that.
Profitability: margin per item, category ROI
Gross margin per item, with cost coming directly from the distributor invoice your PO went to, not whatever stub price was in your spreadsheet. Category-level ROI too. Most shop owners are surprised which categories are actually carrying the margin. Spoiler: it's usually not the new pistols.
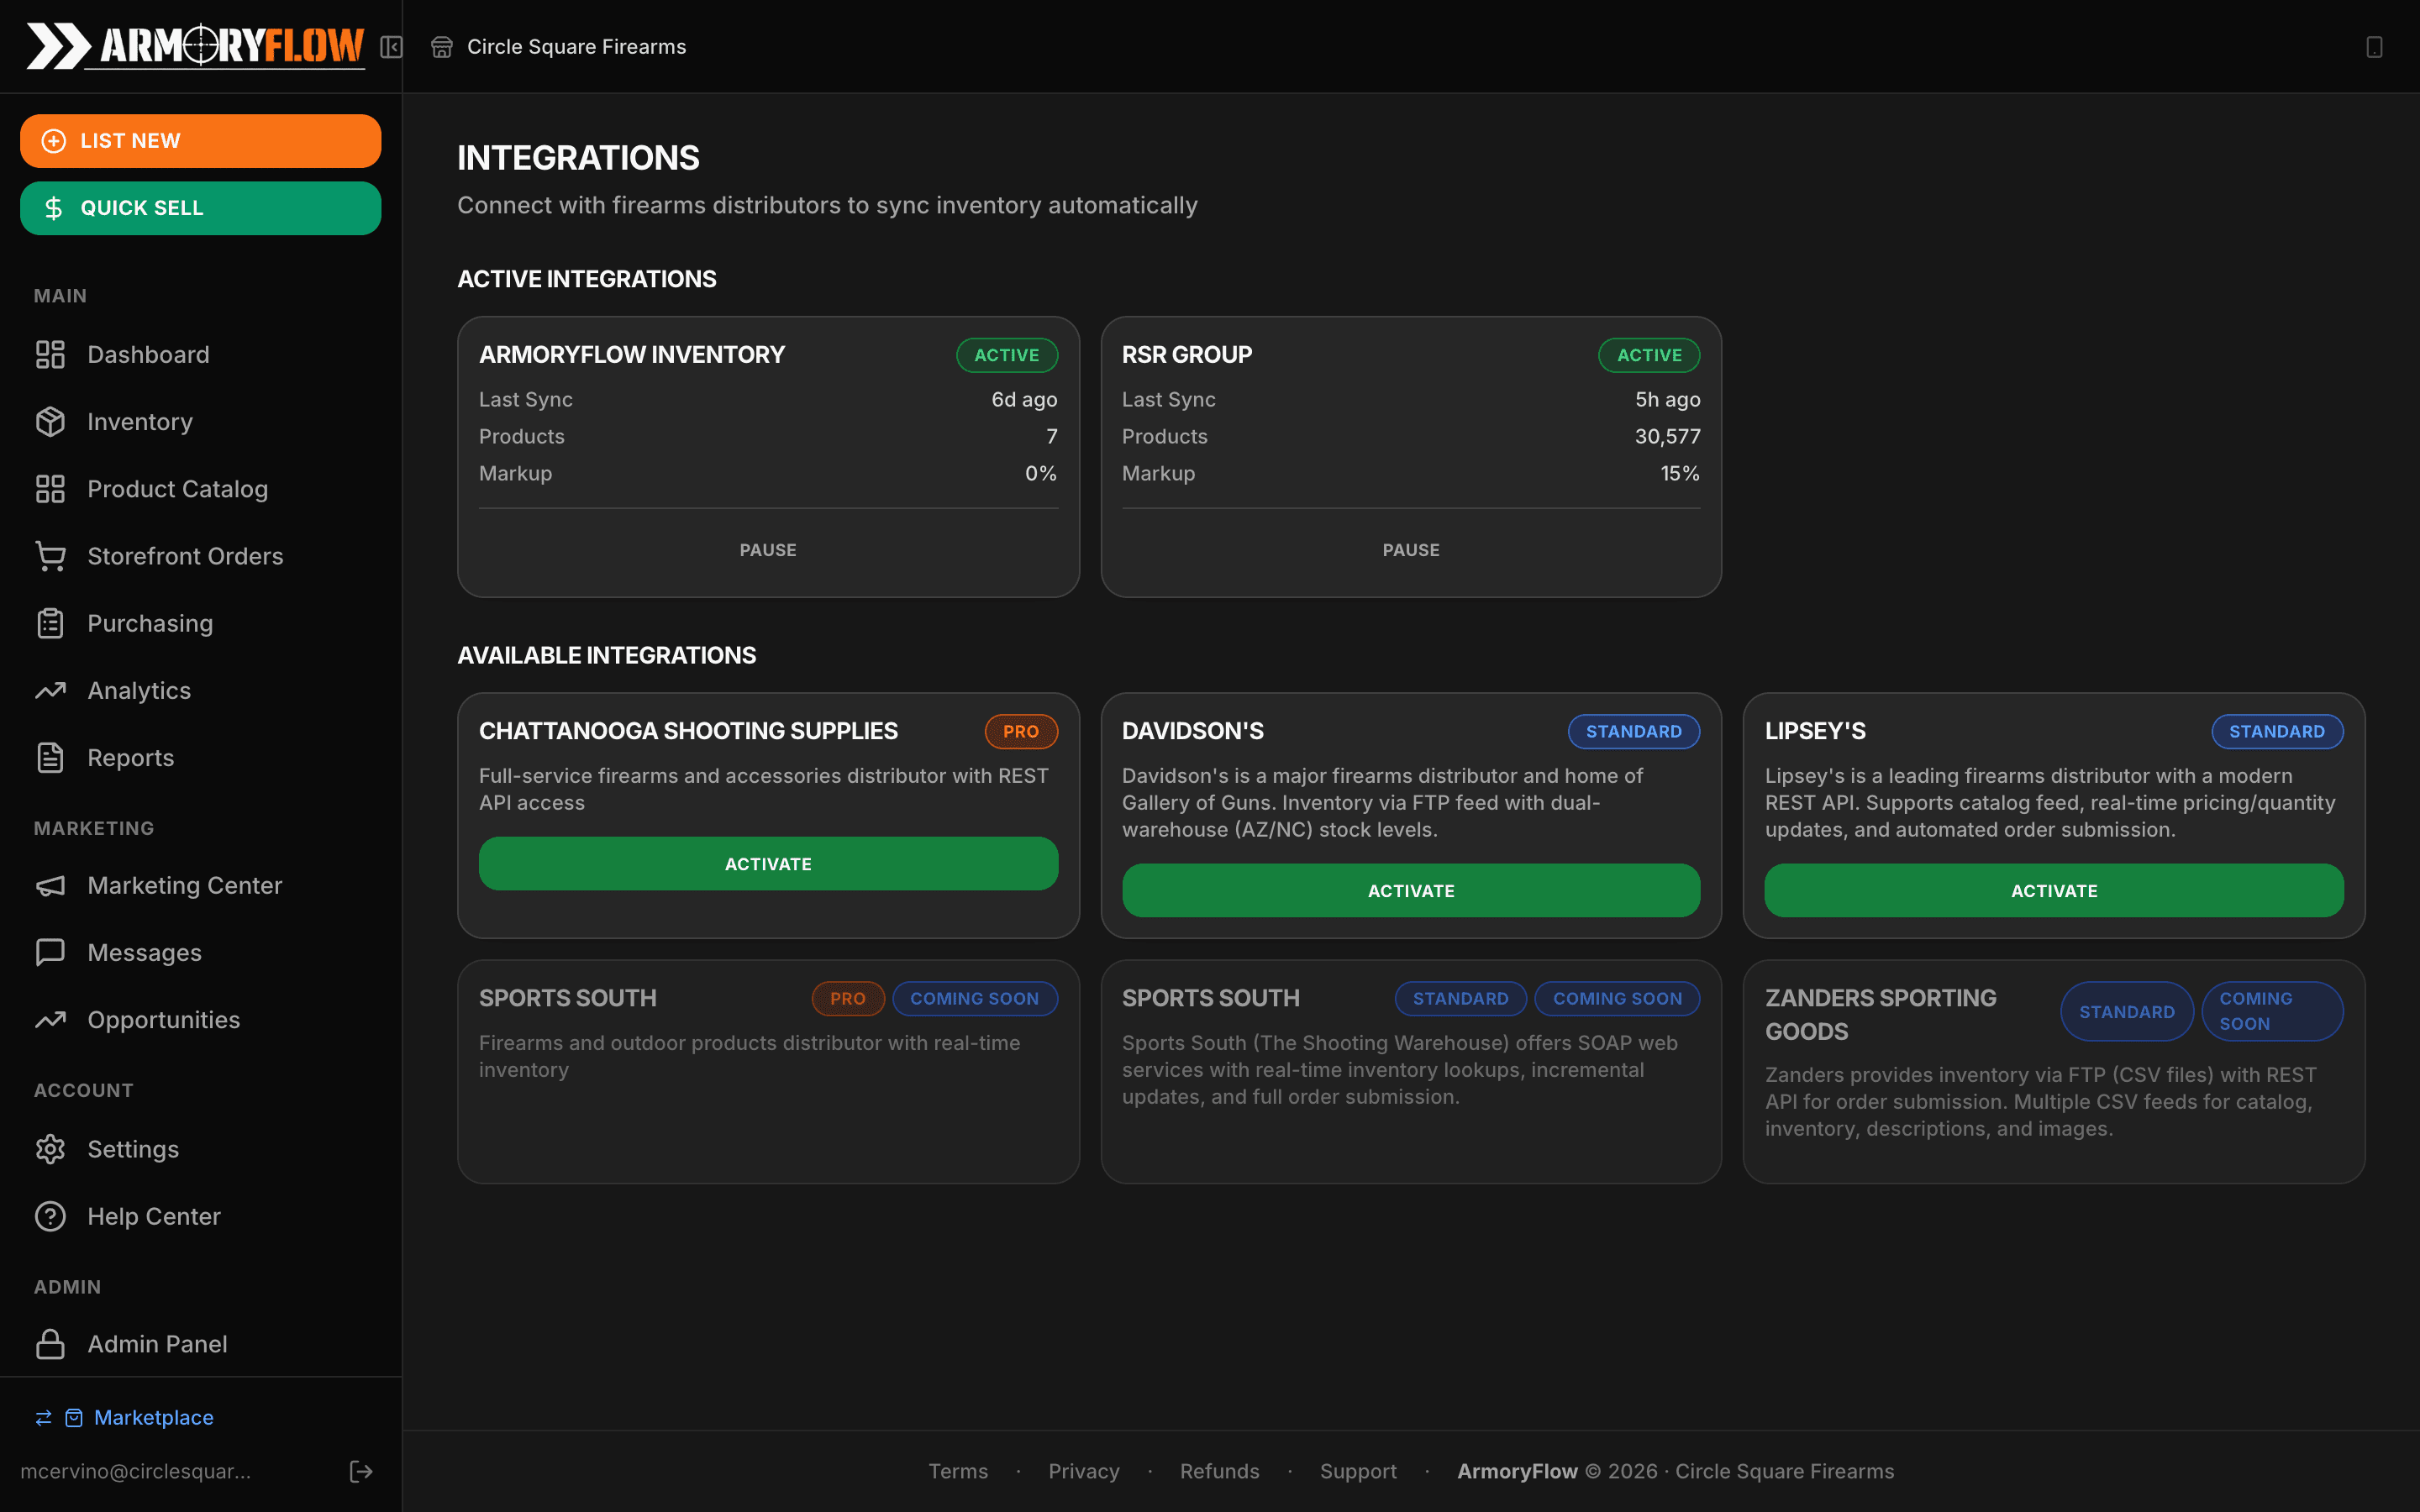
Distributor: which one is actually paying off
Every distributor account you've connected shows up ranked by units sold, margin contribution, and average margin per unit. The rep who calls you most isn't necessarily the one moving the most product. The reverse is also true. Now you have the numbers.
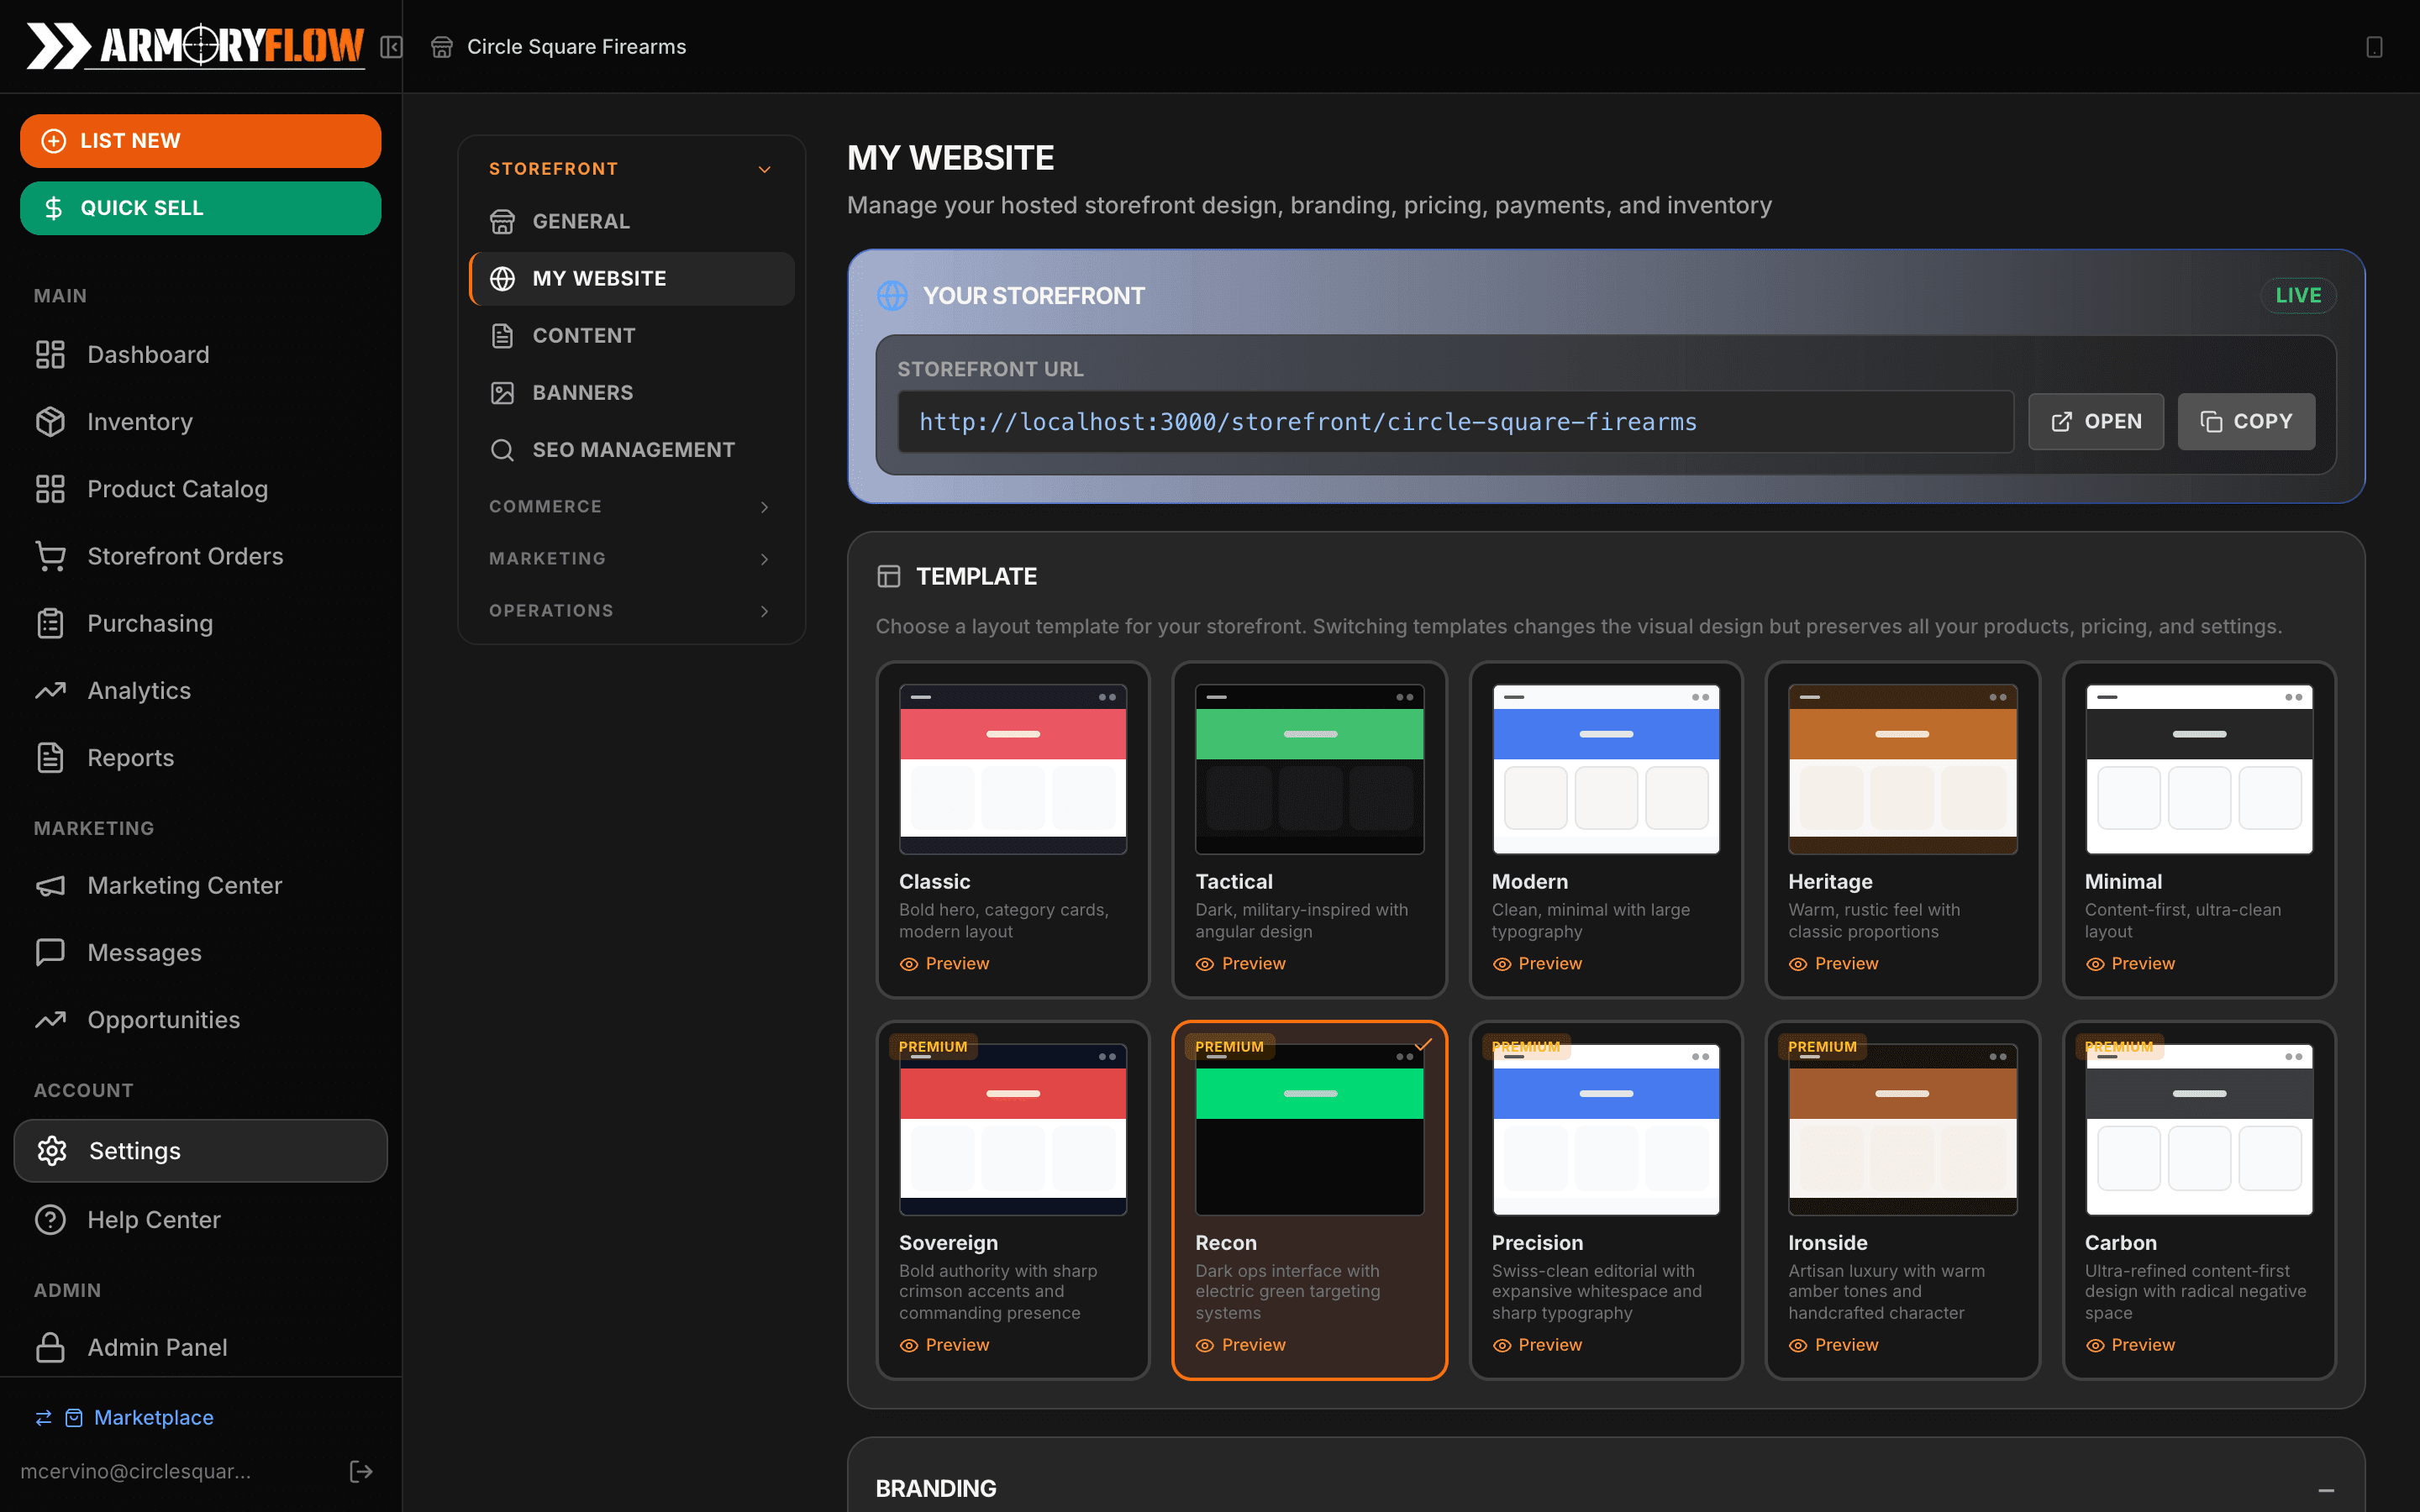
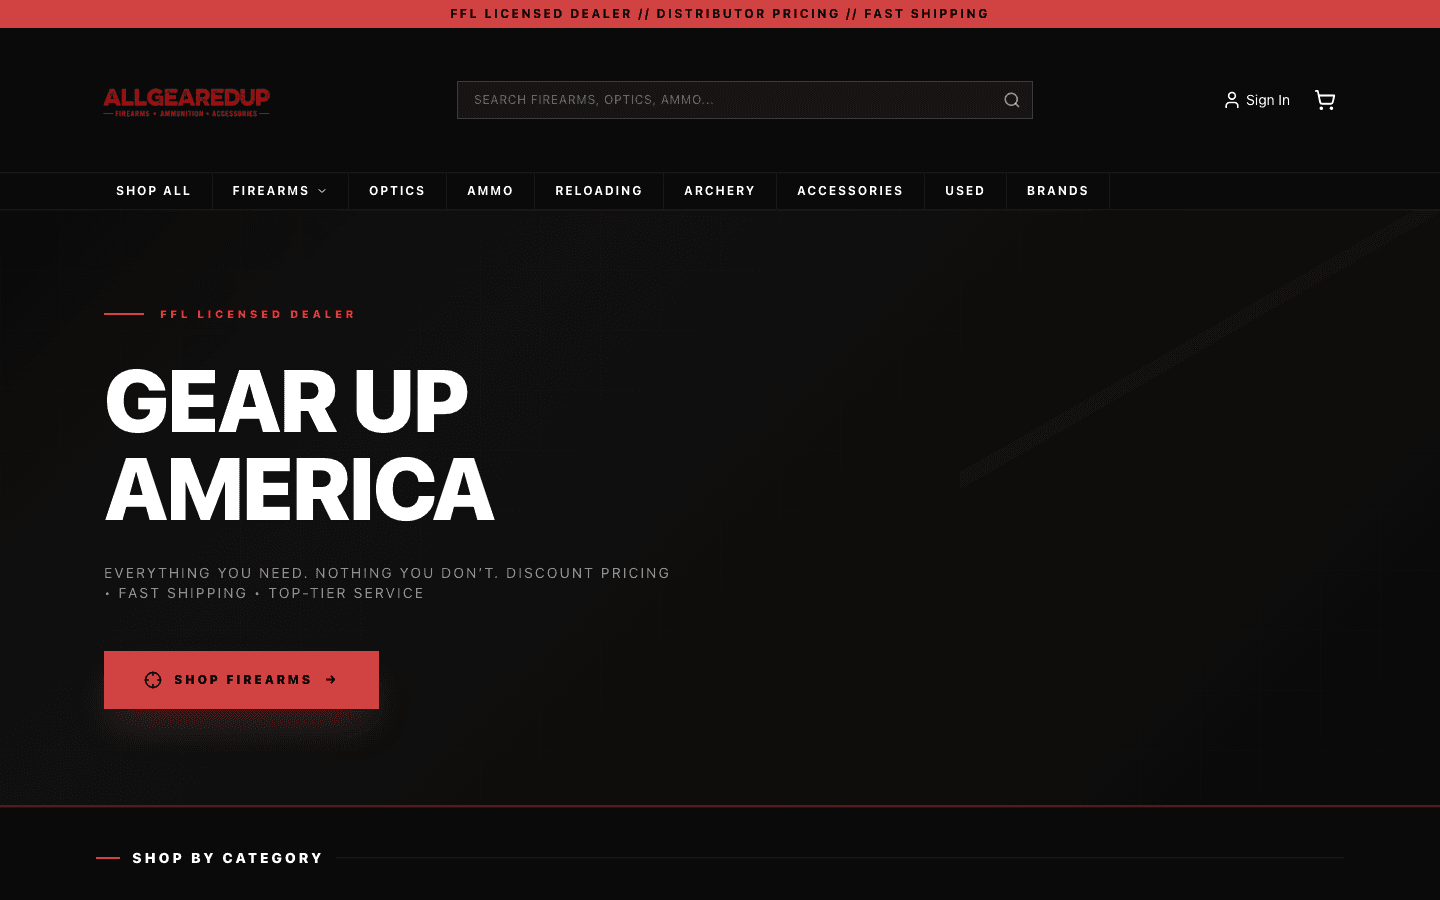
Storefront sections: what customers click
Every hero banner, featured rail, category tile, and CTA on your storefront has its own impressions, clicks, click-through rate, and CTA-click count. The 30-day trend shows which sections are pulling weight and which ones nobody scrolls to. Drag the dead weight down in the Storefront Studio editor and watch the new layout's numbers come in next week.
Available on Grow and Scale tiers
Web traffic: real analytics, no Google Analytics setup
Built in at the edge, so you don't paste a tracking snippet, you don't cookie your customers, and the numbers can't be blocked by an ad blocker. You see:
- Visitors, pageviews, and pages per visitor with day-over-day deltas
- Top pages, ranked by visits
- Where visitors come from: top referrers, search terms, direct, social
- Top countries and top US states
- Device class: phone, tablet, desktop
- Broken links the spider hit, so you can fix the 404 before customers do
- Filter by hostname if you run more than one custom domain
Available on Scale tier
Export to whatever your accountant uses
Every report exports to CSV or PDF. Your numbers go to your accountant, your partner, your bank, or your filing cabinet. If you ever decide to leave ArmoryFlow, all of it comes with you. We'd rather lose a customer with their data intact than try to lock you in with friction.
Available on Scale tier
5
Tabs on one screen
Live
Sales + traffic data
YTD
Compare to prior period
CSV + PDF
Export anywhere
Ready to stop running on gut feel?
14-day trial. Connect your inventory, watch a week of traffic land, see what last quarter actually looked like.
No credit card required • Free 14-day trial